NoteThis case study includes designs and research findings. Chart labels and market data are blurred where they carry privileged information to respect client privacy.
Overview
A Pricing and Forecasting Platform now used across Shell's global chemicals business, from a design workshop in Rotterdam to a first release that nearly tripled weekly active users.
Impact
- Nearly tripled weekly active users with the first releaseFrom 28 to 80 weekly active users, with parallel gains in shared analyses and time in tool, on a problem an external vendor had already failed at once. The business credits the tool with $140 million in added contract profits.
- Reframed a "technology problem" into a trust problemThe Rotterdam design workshop revealed the failed tool was a symptom: data lived everywhere and nobody trusted it. That insight drove a foundation-first data strategy and a no-black-box design principle.
- Designed a system that scaled to five modulesAs product designer, built the design system and module architecture that let the product grow for two and a half years without users relearning anything, now used across Shell's global chemicals business.
The challenge
Shell's Chemicals Commercial Business wrote contracts annually using what they themselves called an "art-based" approach: gut feel, personal spreadsheets, and institutional knowledge. To grow revenue they wanted data-driven pricing decisions, with the ability to track actuals alongside market insights.
They had tried before. An external vendor built a pricing tool in Excel that never met the business's needs, was hard to use, and was eventually abandoned. Stakeholders were tired of talking about it. By the time we arrived, the team had stopped trusting both the tools and the data, and that was the first problem to solve.
Discovery workshop
The Pricing Excellence Tool began with a four-day Launchpad workshop in Rotterdam that I co-led with a service design lead, service designer, and product manager, facilitating among 15+ international participants from across the chemicals business.
Project background, stakeholder mapping, and an ecosystem map. Participants also wrote "Dear John" letters to the failed tools, a structured way to name what went wrong.
Built personas for Commercial Analysts, Marketing Managers, and Sales/Product Managers; mapped use cases and voted on the most frustrating and most valuable steps.
Co-created problem statements and a north-star product vision; wrote user stories by product line.
Participants sketched the tool themselves; we converged on a layout, prioritized the feature backlog, and named the risks.
Insights
The problem arrived at the Agile Hub framed as a technology problem: "the tool needs to be improved." The workshop revealed the technology issues were symptoms. The real problems: data lived in too many places, and nobody fully trusted it.
Commercial Analysts wanted to spend their time on strategy. Instead, their days went to pulling pricing data for everyone else's requests, and gathering that data was voted the single most frustrating step by every user group. The group was also emphatic about trust: no black box. Users needed to check the inputs, see the source formulas, and follow the business logic behind every number.
So the team aligned on a foundation-first strategy: build a central data repository (a data lake) before the analytics, captured in a shared vision:
"An easy to use tool that can be trusted and is transparent across all roles and regions so that users have the power to make informed pricing decisions to maximize margins."Product vision, co-created at the Rotterdam workshop
End-to-end design
From there I owned design across the product's life: research touchpoints with users, scheduled with the week's notice they asked for, journey maps, wireframes, prototypes, and UI specifications for the development team. I worked in sprints alongside the PM, tech lead, and 12 developers, embedded with a product owner and subject-matter experts from the business.
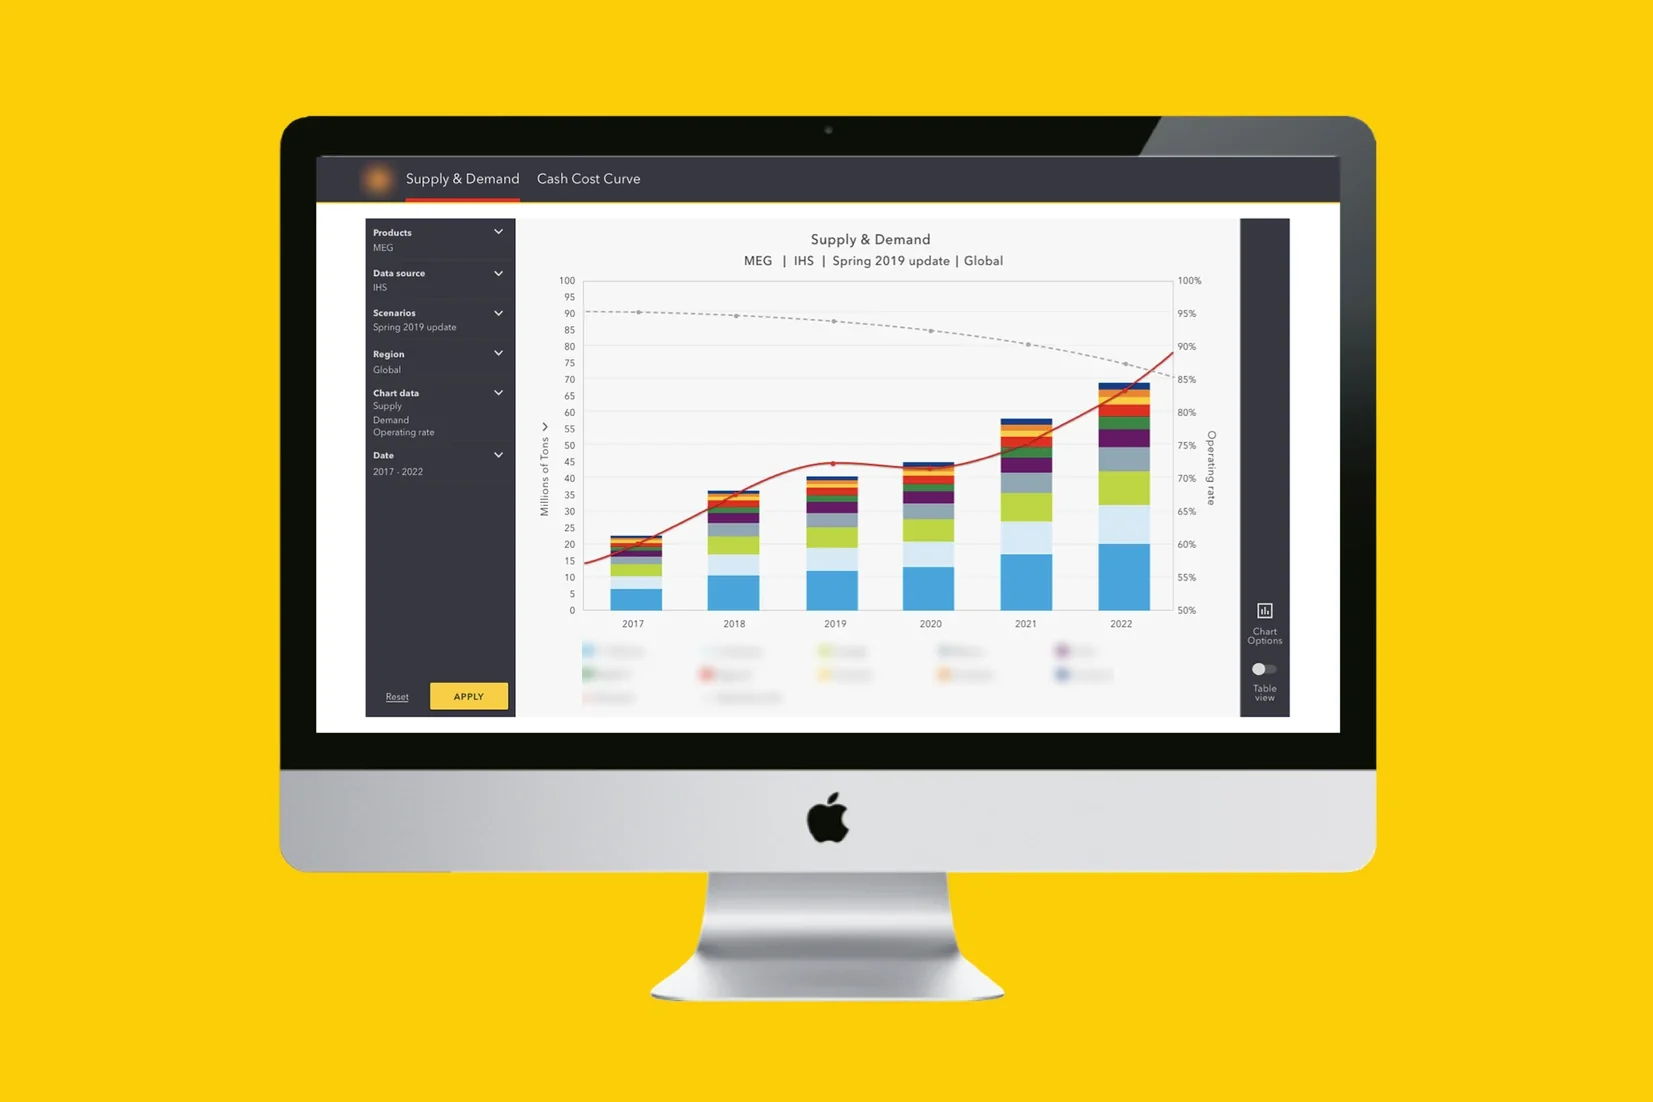
The dashboard wireframe sketched with users in Rotterdam became the seed of the product: a data panel for products, regions, sources, currencies and units on the left; charts with comments and export on the right. Sprint by sprint that grew into the shipped product: a Price Viewer where users plug their actual contract formulas in and run them against industry markers to see if their contracts beat the market; Supply & Demand modules with outage tracking to spot tightening markets; manual price forecasting; and personalized dashboards.
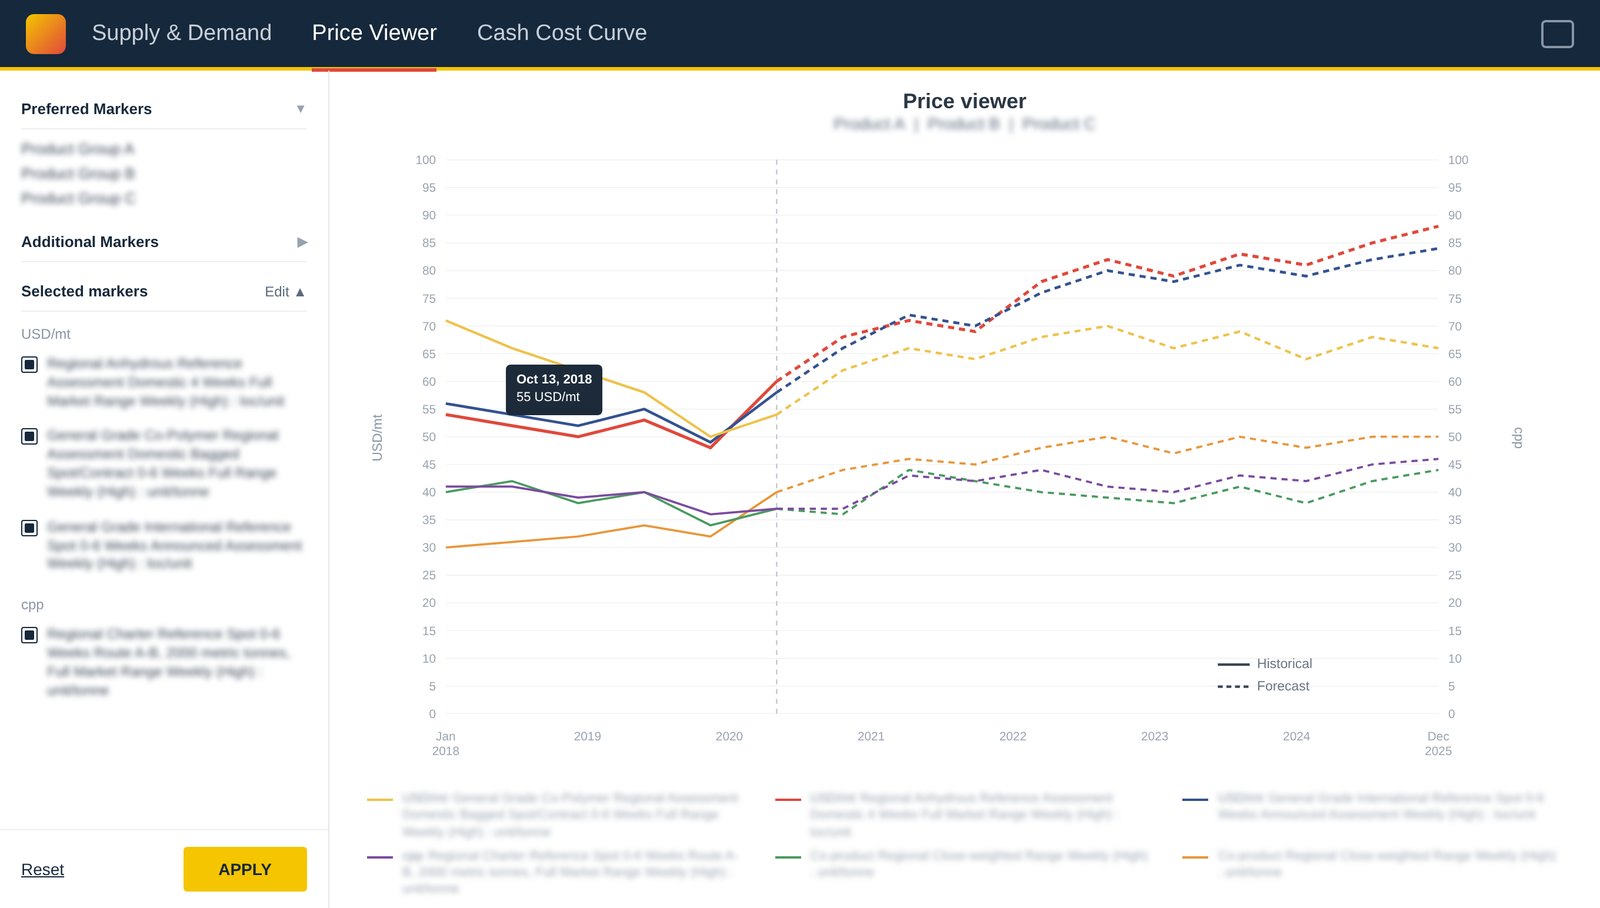
Two design principles carried through every sprint, straight from the workshop's risk list. The first was transparency: users had been burned by a black-box tool before, so every chart can show the formula and the data source behind it, and anyone can check where a number came from before acting on it. The second was consistency across roles and regions, so an analyst in Houston and a marketing manager in Singapore read the same numbers the same way.
Designing the system
Shipping one screen at a time for two and a half years only works if the parts agree with each other. I built and maintained the product's design system: a UI kit (first in Sketch, later Figma), a color palette tuned for dense data visualization, and a consistent architecture every module inherits: a dark data panel on the left for products, regions, scenarios and units; a light chart canvas on the right with export, chart options, and comments.
That skeleton let the product grow to five modules without users relearning anything: Supply & Demand, Price Viewer, Cash Cost Curve, Value in Use, and user Profiles. It also carried the collaboration layer the workshop asked for: comments and replies on outages, super-user roles for maintaining shared data, notifications, and the ability to save, organize, and share analyses from a personal account, so an analysis stops being one person's spreadsheet and becomes something the whole team can pick up.
Outcome
The tool's first release nearly tripled weekly active users, from 28 to 80. Shared analyses and time in tool grew with it. Development continued sprint after sprint for two and a half years, expanding to more product lines and integrating with a sister deal-analysis tool. It's now used across Shell's global chemicals business, and the product owner credits it with a $140 million increase in contract profits.
The result that mattered most to me was the one from the workshop's closing circle:
"I feel like we had to go through this process to get to this point. Now this feels like one team. It feels like our solution."Workshop participant, Chemicals Commercial Business